This Interactive Map Lets You Track the Price of Any Cryptocurrency
Cryptomaps shows all the pieces in the cryptocurrency pie.

Whether you’ve already bought into bitcoin and other cryptocurrencies, or you’re simply curious about how their values fluctuate, a new website is making it easy to observe the marketplace.
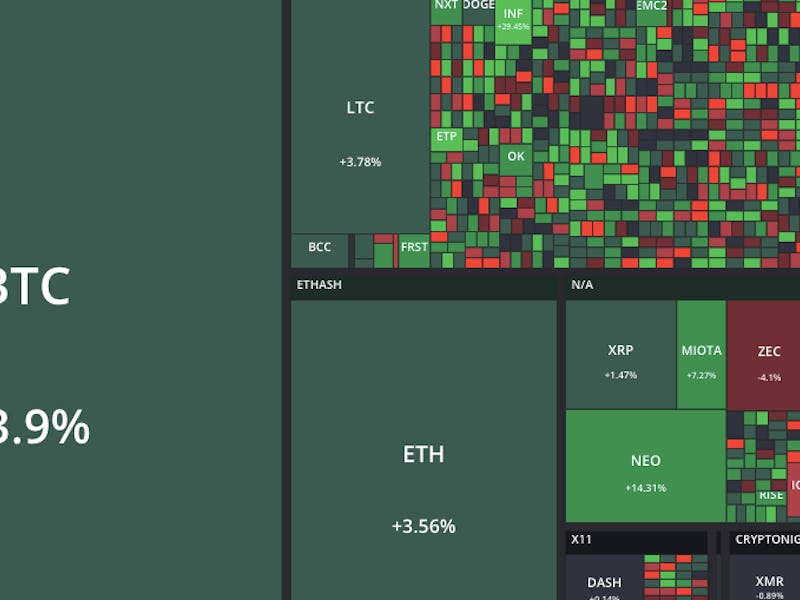
Cryptomaps is an interactive website featuring a heat map of basically every relatively-known cryptocurrency that exists. Using colors to illustrate rising and falling percentages, Cryptomaps shows the values and volumes of Bitcoin, Litecoin, Ethereum and more. Using features on the left hand side of the screen, you can choose whether you want to see how values have changed over the week, day, or even hour. By hovering over a given currency, you can see its value in BTC and in U.S. dollar, as well as any growth or decline over a given period of time.
A screenshot of Cryptomaps shows how it illustrates a week's worth of cryptocurrency performance on September 30, 2017.
One thing to keep in mind is that it’s unclear on Cryptomaps where the data it displays is being sourced from, or how often it’s updated. While the numbers match up pretty well with other exchange sites, it might be best appreciated as a highly visual tool to be used in conjunction with other resources if you’re thinking about buying or selling cryptocurrency.