This Highly-Detailed 3D Ocean Map Will Save Marine Life
Ecological Marine Units (EMUs) will help researchers understand the oceans.

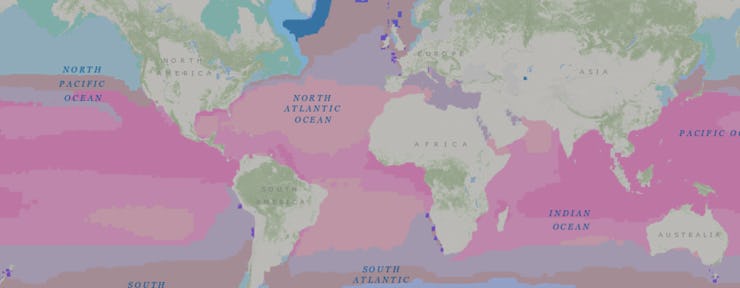
Researchers are using a 3D map of the ocean to get a detailed understanding of life beneath the surface, a breakthrough that could help preserve the fragile ecosystems that basically keep the entire world alive. Ecological Marine Units (EMUs), created by the Environmental Systems Research Institute (ESRI), combines a staggering amount of data into an accessible form, allowing users to drill deep into formerly incomprehensible information sets.
“It’s like total world domination in ecosystem mapping,” Roger Sayre, an ecologist at the US Geological Survey in Reston, Virginia and co-head of the EMU project, said in a statement released Tuesday.
The new mapping program is a groundbreaking development, and one that could help researchers understand why some marine life prefer certain areas to others. For example, the map reveals how in some areas of the Pacific Ocean, low-oxygen areas dip deeper into the sea than in others, developing a complex picture of why certain areas might support life better than others. Understanding this is key to preservation.
The map doesn’t really use new data, but presents existing data in a simpler context by analyzing measured data and trying to map it onto the globe. The map uses 52 million data points measured over a 50-year period by the National Oceanic and Atmospheric Administration (NOAA), grouping a set of key variables from the data set into individual ocean columns. These columns, clickable on the interactive map, span roughly 17 miles wide at the equator.
The pink dots are clickable columns.
ESRI did, however, spatially analyze the data to place it on the map, so it’s not a simple case of taking the NOAA’s data and popping it onto any old chart. The resultant map is now available for organizations using geographic information system (GIS) technology to build into their existing work.
“It’s an interesting thing to look at in three dimensions, fairly unique and gratifying,” Patrick Halpin, a marine ecologist at Duke University, said in a statement.
Ocean maps that try to track this data are nothing new, but it’s the 3D aspect that’s unique. ESRI has presented sub-surface data in a way that’s easy to understand, where many systems simply track ocean or surface data. Best of all, it’s free to use as part of an interactive web app.
“What’s often missing is all that’s between the surface of the ocean and the ocean bottom,” Dawn Wright, chief scientist at ESRI, said in a statement. “That’s what our project will hopefully bring to the table.”
Explore the map in the web viewer here.